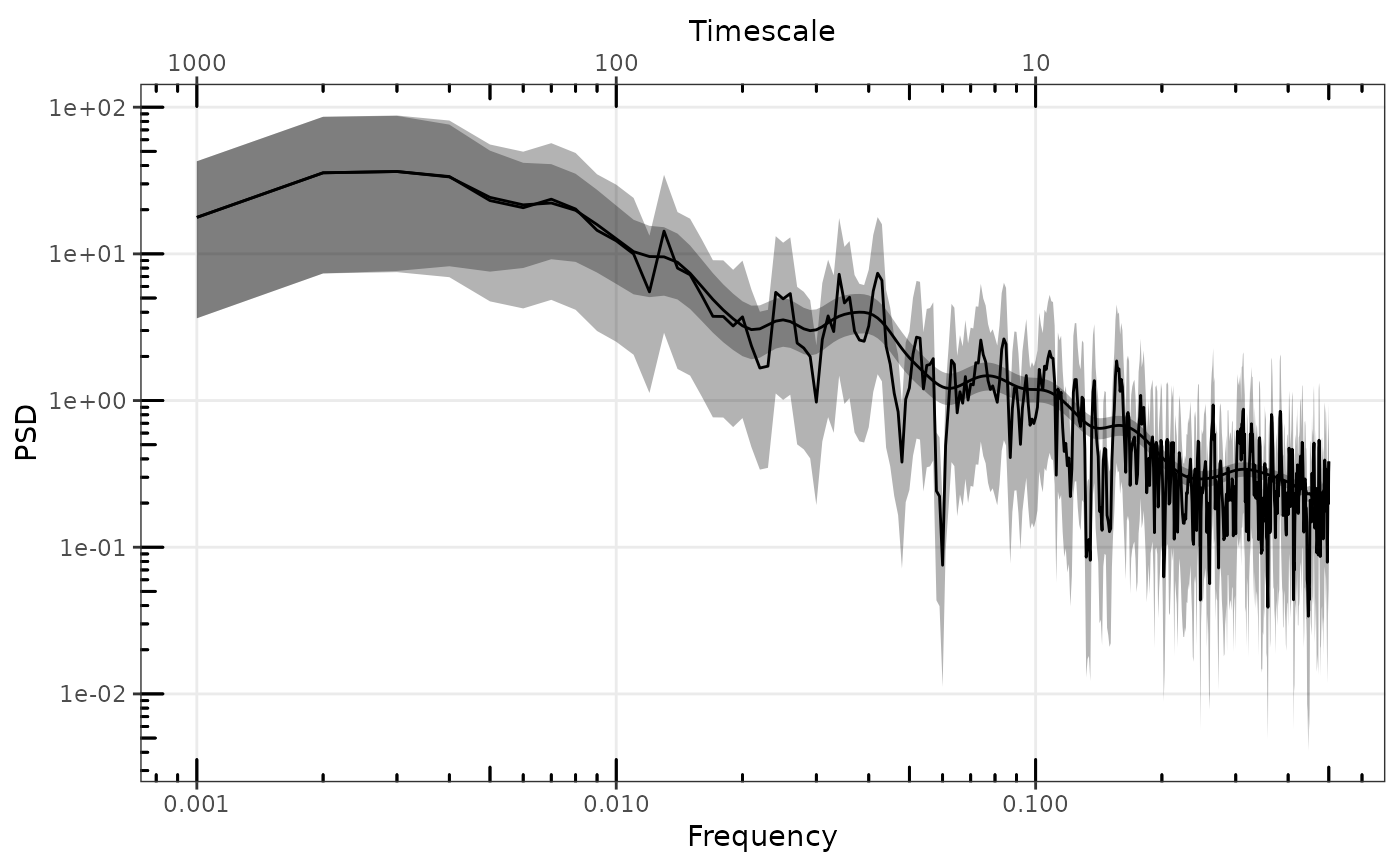
Plot One or More Spectra with ggplot2
gg_spec.RdPlot One or More Spectra with ggplot2
Usage
gg_spec(
  x,
  gg = NULL,
  conf = TRUE,
  spec_id = NULL,
  colour = spec_id,
  group = spec_id,
  linetype = NULL,
  alpha.line = 1,
  alpha.ribbon = c(0.166, 0.333),
  removeFirst = 0,
  removeLast = 0,
  min.colours = 2,
  force.lims = FALSE,
  force.CI = NULL,
  quantiles = FALSE,
  time_unit = NULL
)
Arguments
- x
An object of class "spec" or "spec_df"
- gg
An existing ggplot object on which to add a new spec layer
- conf
Plot shaded confidence interval if it exists in the spec object
- spec_id
Name for this plot layer
- colour
Name of variable map to colour, unquoted
- group
Name of variable to map to group, unquoted
- linetype
Name of variable map to linetype, unquoted
- alpha.line
Alpha level for the spectra line(s)
- alpha.ribbon
Alpha level for the confidence region(s)
- removeFirst, removeLast
Remove first or last "n" values on the low or high frequency side respectively. Operates on a per group basis.
- min.colours
Minimum number of spectra before starting to colour them separately
- force.lims, force.CI
Force the plotting of confidence regions when the total number of frequencies exceeds 10000. force.CI is deprecated, use force.lims. Defaults to FALSE
- quantiles
Plot uncertainty quantiles if they exist in the spec object
- time_unit
Optional string giving the time unit for axes labels, e.g. "years"
Examples
library(PaleoSpec)
N <- 1e03
beta <- 1
alpha <- 0.1
ts1 <- SimPLS(N = N, b = beta, a = alpha)
ts2 <- SimPLS(N = N, b = beta, a = alpha)
sp1 <- SpecMTM(ts1, deltat = 1)
sp1 <- AddConfInterval(sp1)
sp2 <- SpecMTM(ts2, deltat = 1)
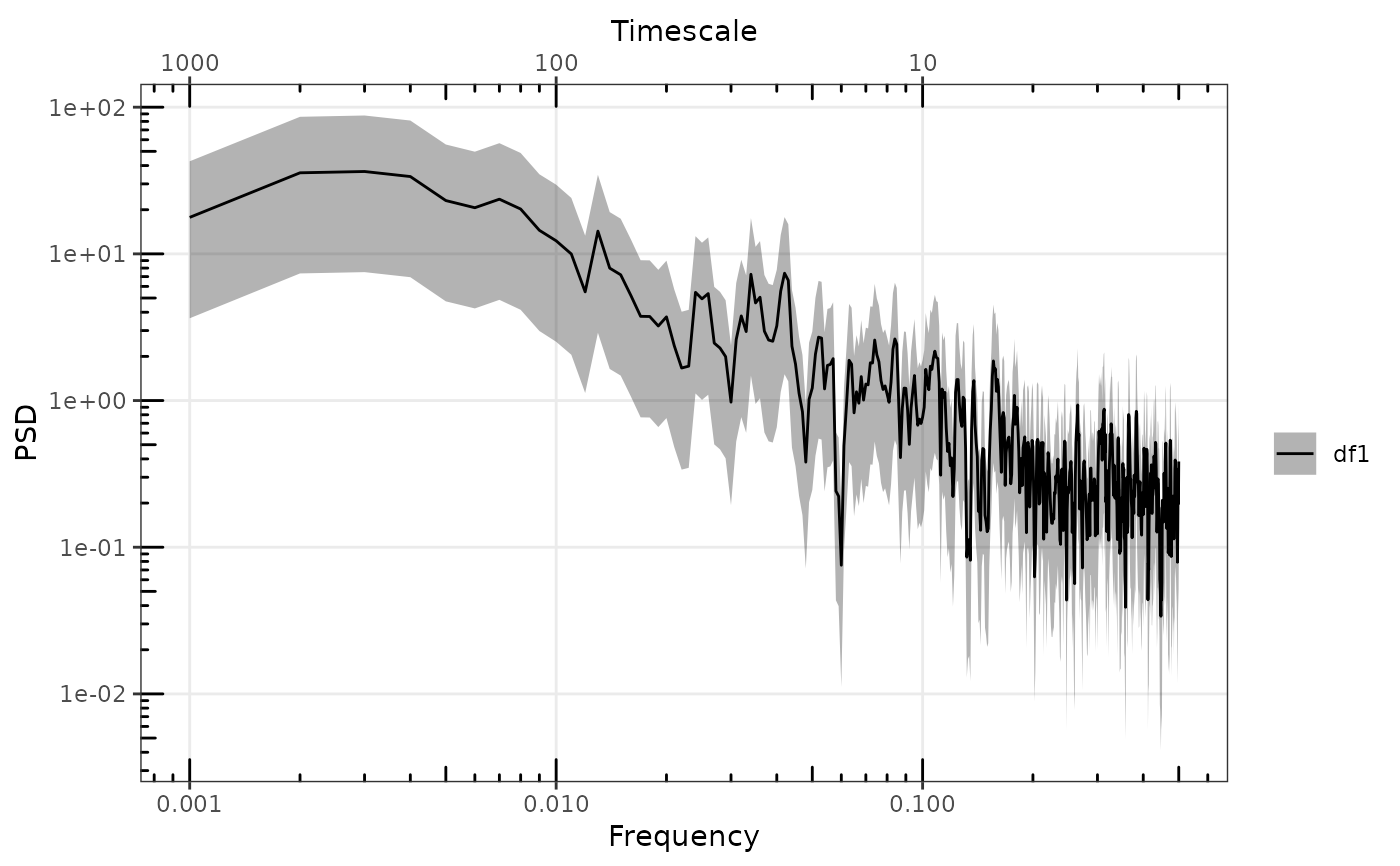
# plot single spectrum
p <- gg_spec(sp1, spec_id = "df1")
#> Scale for colour is already present.
#> Adding another scale for colour, which will replace the existing scale.
p
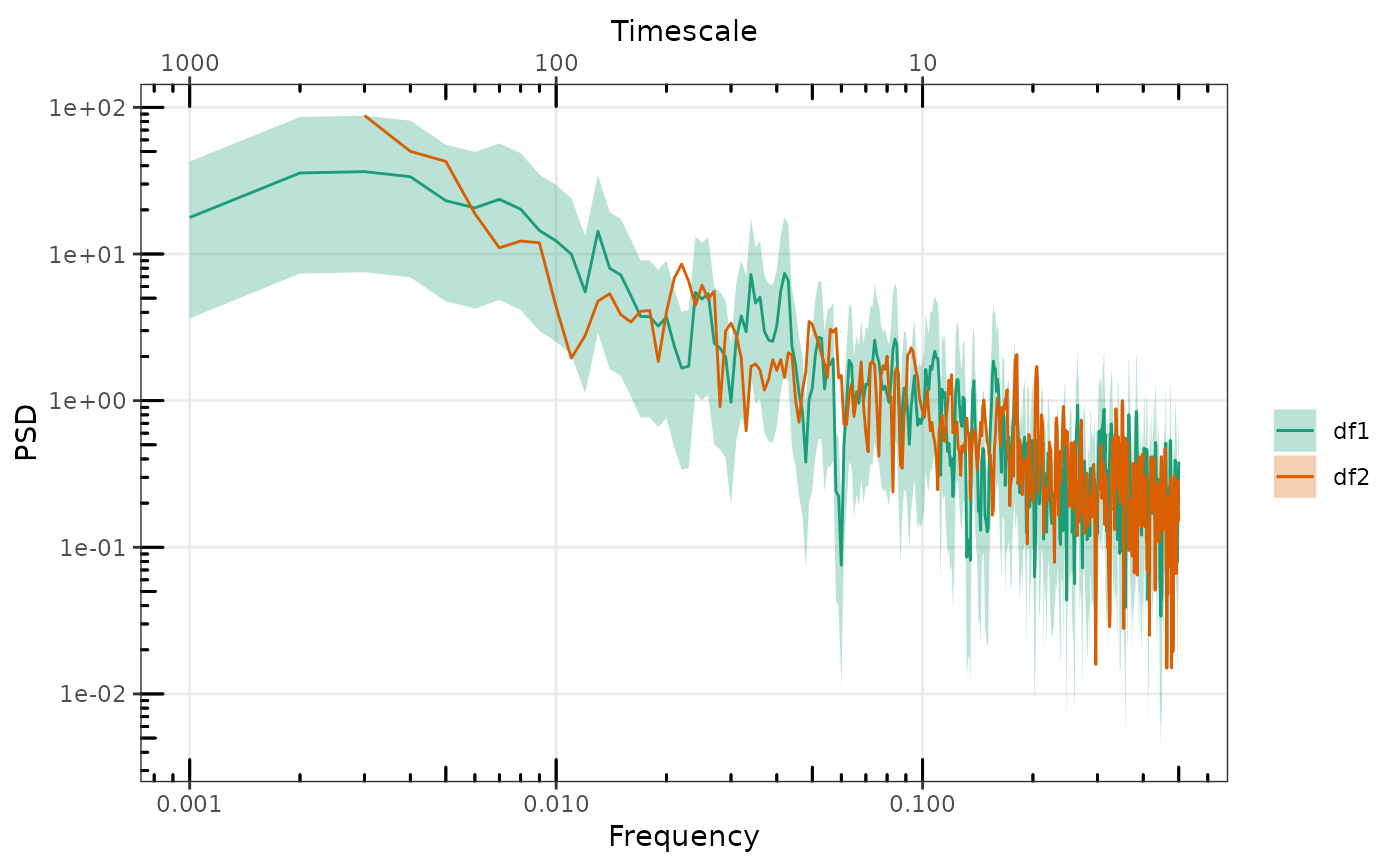
 # Add additional second spectra
p <- gg_spec(sp2, p, spec_id = "df2", removeFirst = 2)
#> Scale for x is already present.
#> Adding another scale for x, which will replace the existing scale.
#> Scale for y is already present.
#> Adding another scale for y, which will replace the existing scale.
#> Scale for colour is already present.
#> Adding another scale for colour, which will replace the existing scale.
#> Scale for alpha is already present.
#> Adding another scale for alpha, which will replace the existing scale.
p
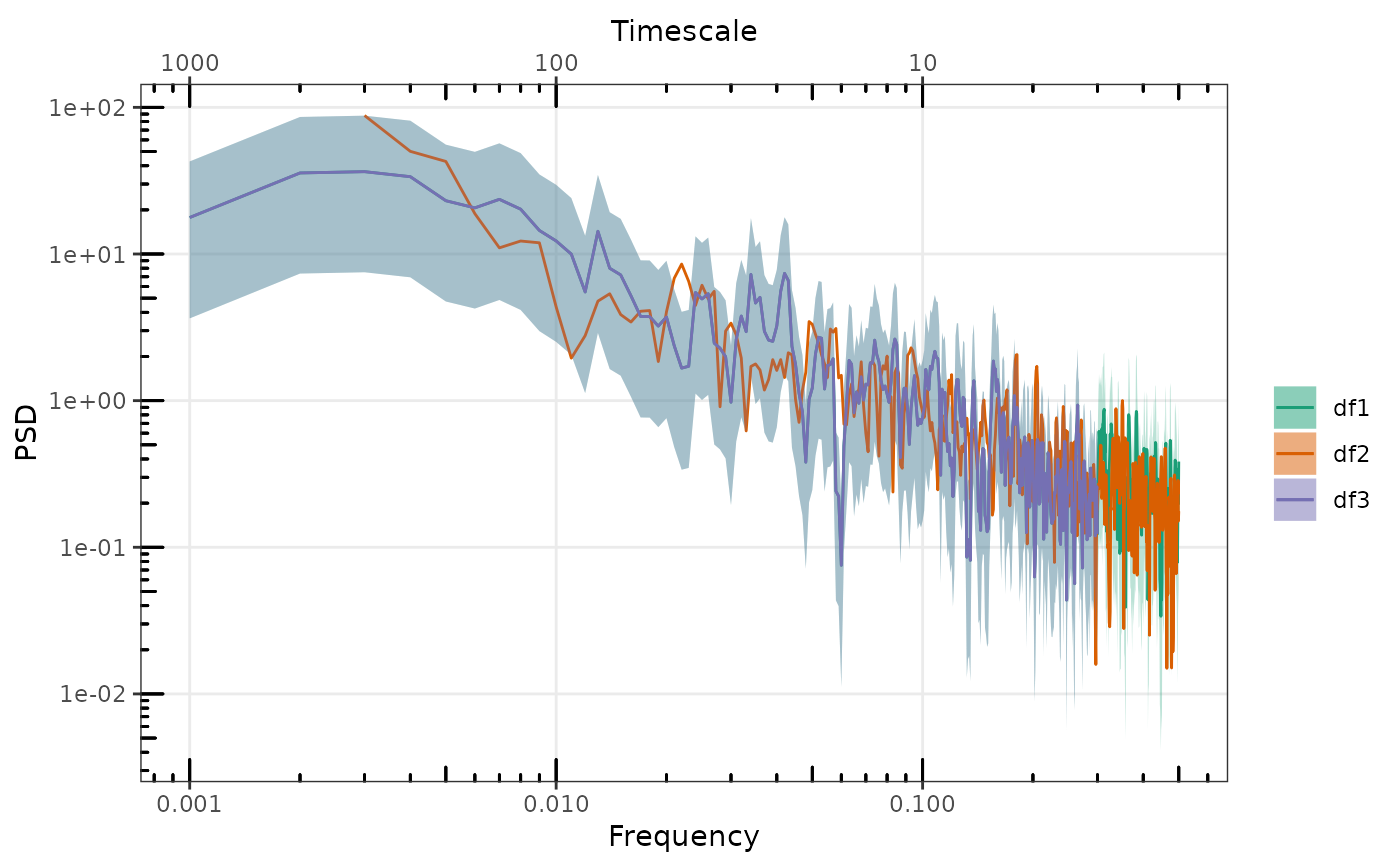
 p <- gg_spec(sp1, p, spec_id = "df3", removeLast = 200)
#> Scale for x is already present.
#> Adding another scale for x, which will replace the existing scale.
#> Scale for y is already present.
#> Adding another scale for y, which will replace the existing scale.
#> Scale for colour is already present.
#> Adding another scale for colour, which will replace the existing scale.
#> Scale for alpha is already present.
#> Adding another scale for alpha, which will replace the existing scale.
p
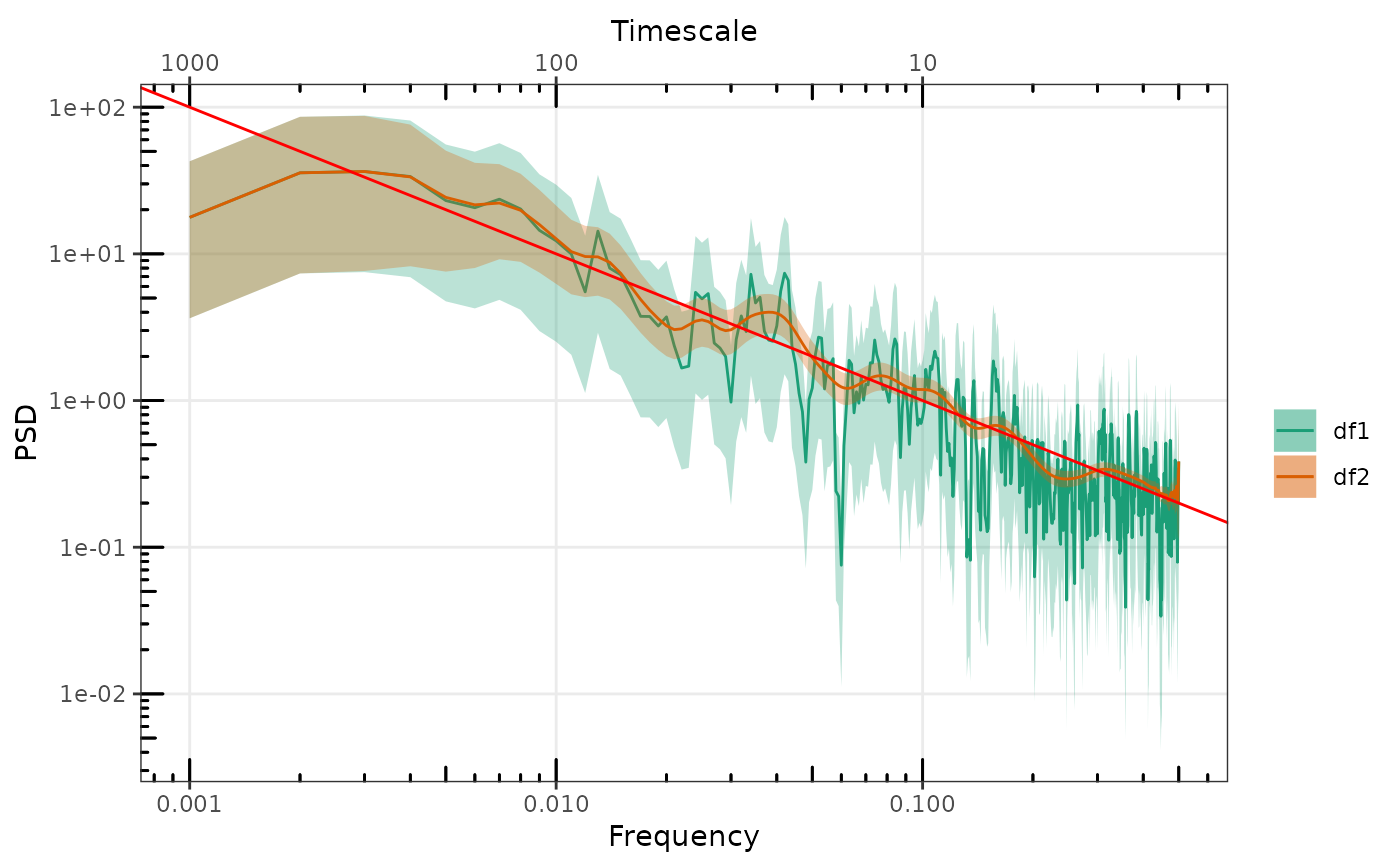
 sp2 <- LogSmooth(sp1)
p <- gg_spec(sp1, spec_id = "df1")
#> Scale for colour is already present.
#> Adding another scale for colour, which will replace the existing scale.
p <- gg_spec(sp2, p, spec_id = "df2")
#> Scale for x is already present.
#> Adding another scale for x, which will replace the existing scale.
#> Scale for y is already present.
#> Adding another scale for y, which will replace the existing scale.
#> Scale for colour is already present.
#> Adding another scale for colour, which will replace the existing scale.
#> Scale for alpha is already present.
#> Adding another scale for alpha, which will replace the existing scale.
p <- p + ggplot2::geom_abline(intercept = log10(alpha), slope = -beta, colour = "red")
p
 # Or directly plot named or unnamed list
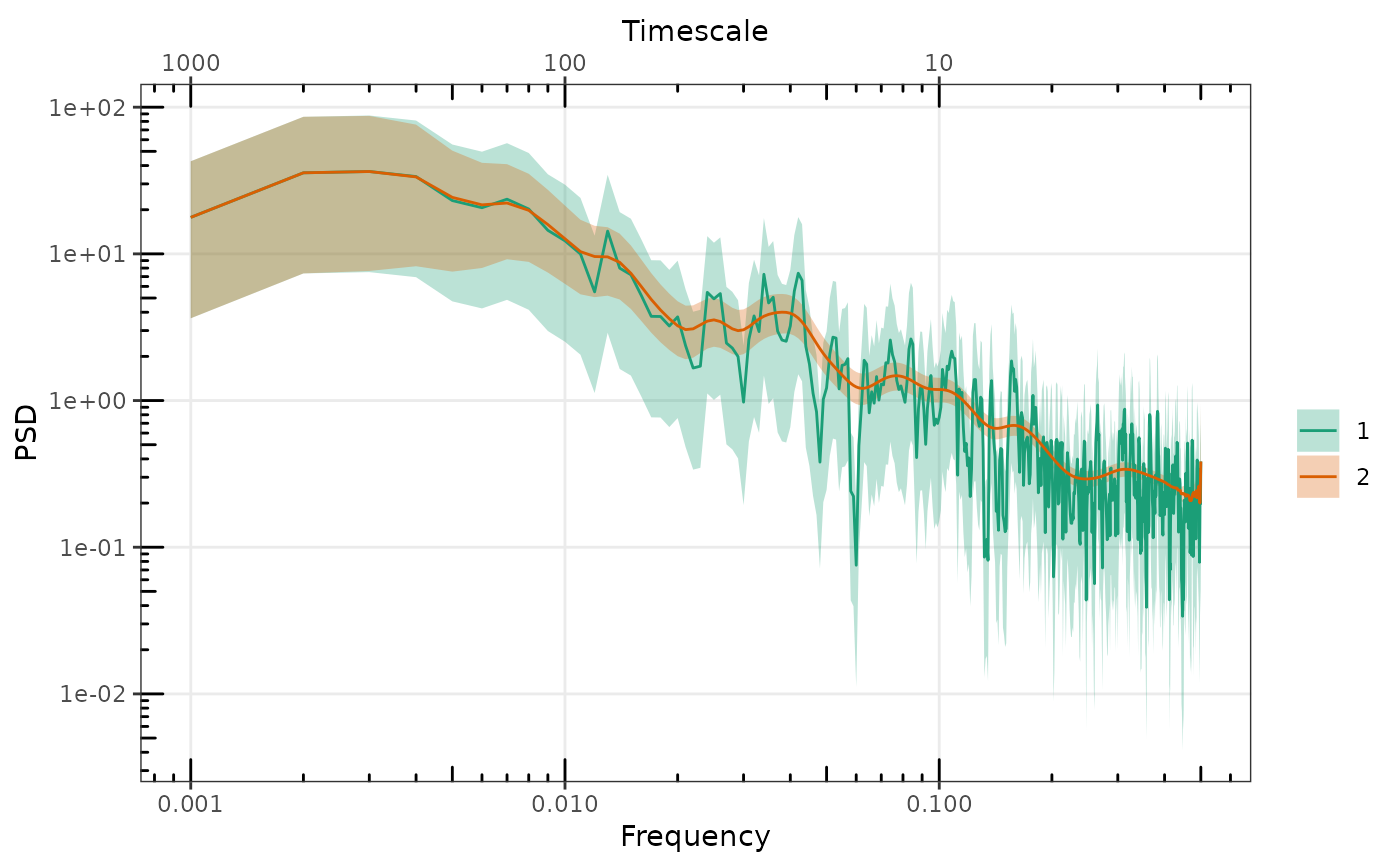
gg_spec(list(sp1, sp2))
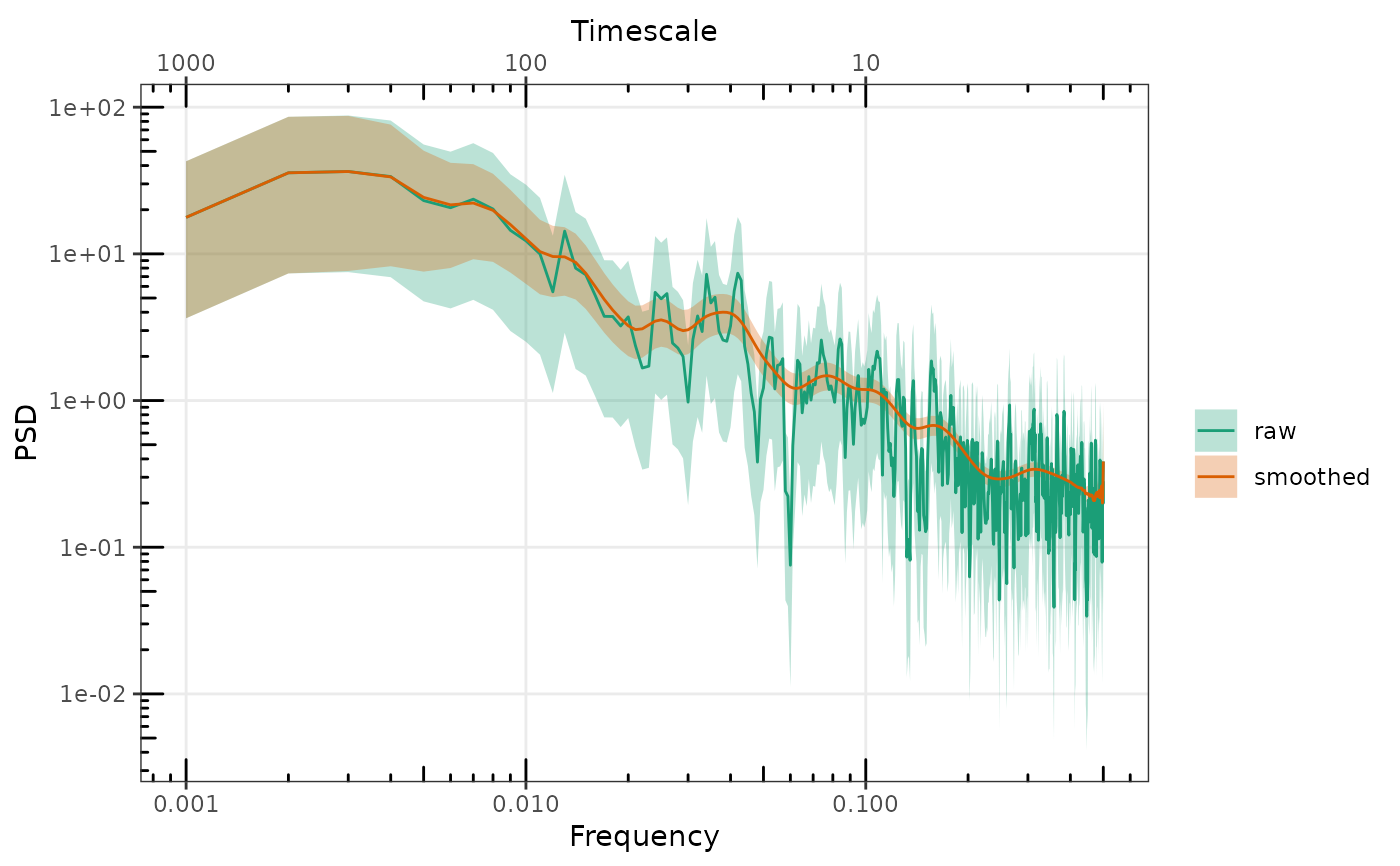
 gg_spec(list(raw = sp1, smoothed = sp2))
 # without setting any names all spectra will be black
p <- gg_spec(sp1)
#> Scale for colour is already present.
#> Adding another scale for colour, which will replace the existing scale.
sp2 <- LogSmooth(sp1)
p <- gg_spec(sp2, p)
#> Scale for x is already present.
#> Adding another scale for x, which will replace the existing scale.
#> Scale for y is already present.
#> Adding another scale for y, which will replace the existing scale.
#> Scale for colour is already present.
#> Adding another scale for colour, which will replace the existing scale.
#> Scale for alpha is already present.
#> Adding another scale for alpha, which will replace the existing scale.
#> Scale for colour is already present.
#> Adding another scale for colour, which will replace the existing scale.
p
