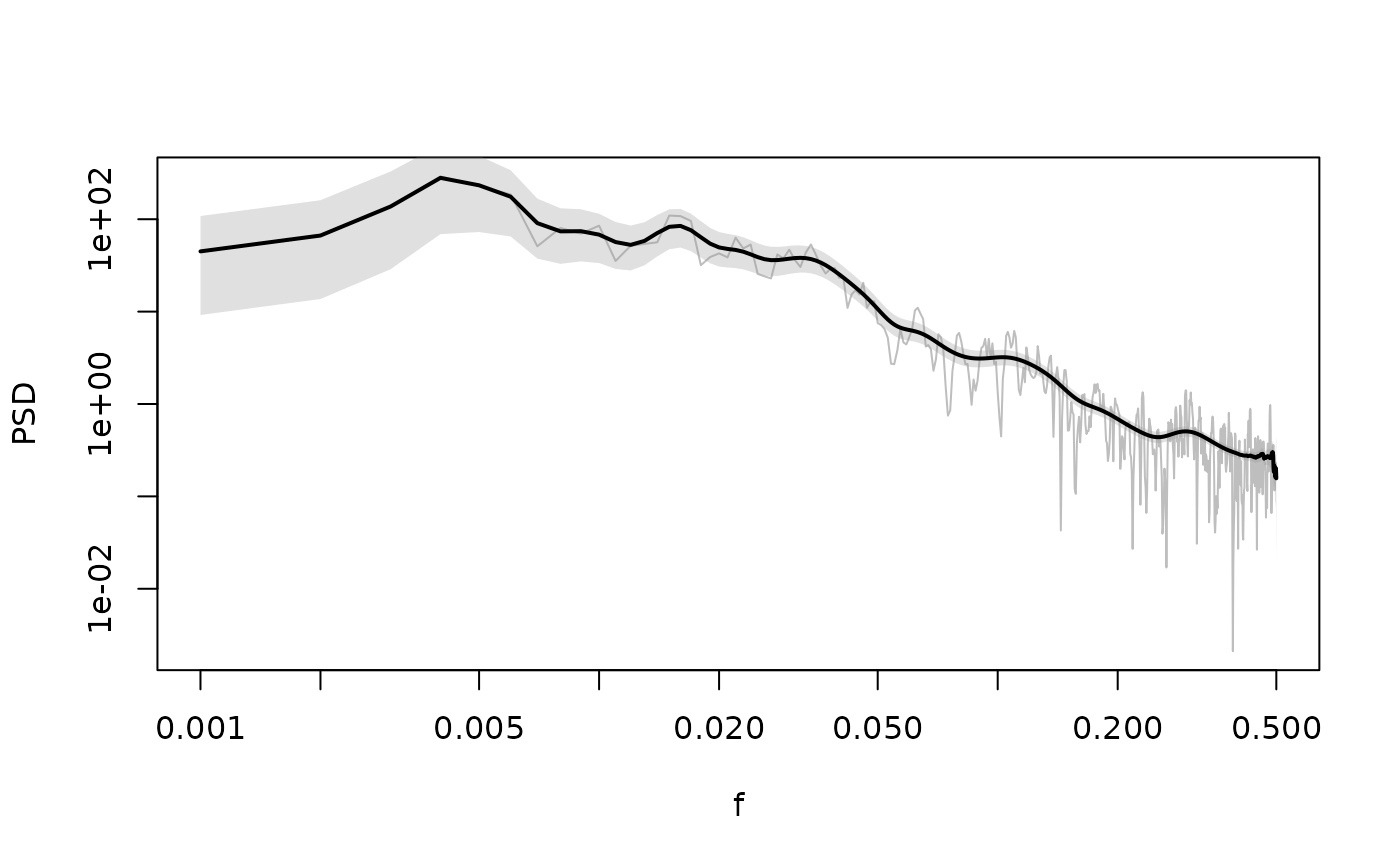
Add a spectrum to an existing log-log spectral plot.
LLines.RdThis function adds a spectrum to an existing double-logarithmic plot and optionally adds a transparent confidence interval.
Usage
LLines(
  x,
  conf = TRUE,
  bPeriod = FALSE,
  col = "black",
  alpha = 0.3,
  removeFirst = 0,
  removeLast = 0,
  ...
)
Arguments
- x
a spectral object resulting from a call to
SpecMTM.- conf
if
TRUE(the default) add a transparent confidence interval (suppressed ifxcontains no error limits).- bPeriod
if
TRUEthe x-axis is displayed in units of period (inverse frequency), increasing to the left. Defaults toFALSE.- col
color for the line plot and the confidence interval.
- alpha
transparency level (between 0 and 1) for the confidence interval. Defaults to
0.3.- removeFirst
omit
removeFirstvalues on the low frequency side.- removeLast
omit
removeLastvalues on the high frequency side.- ...
further graphical parameters passed to
lines.