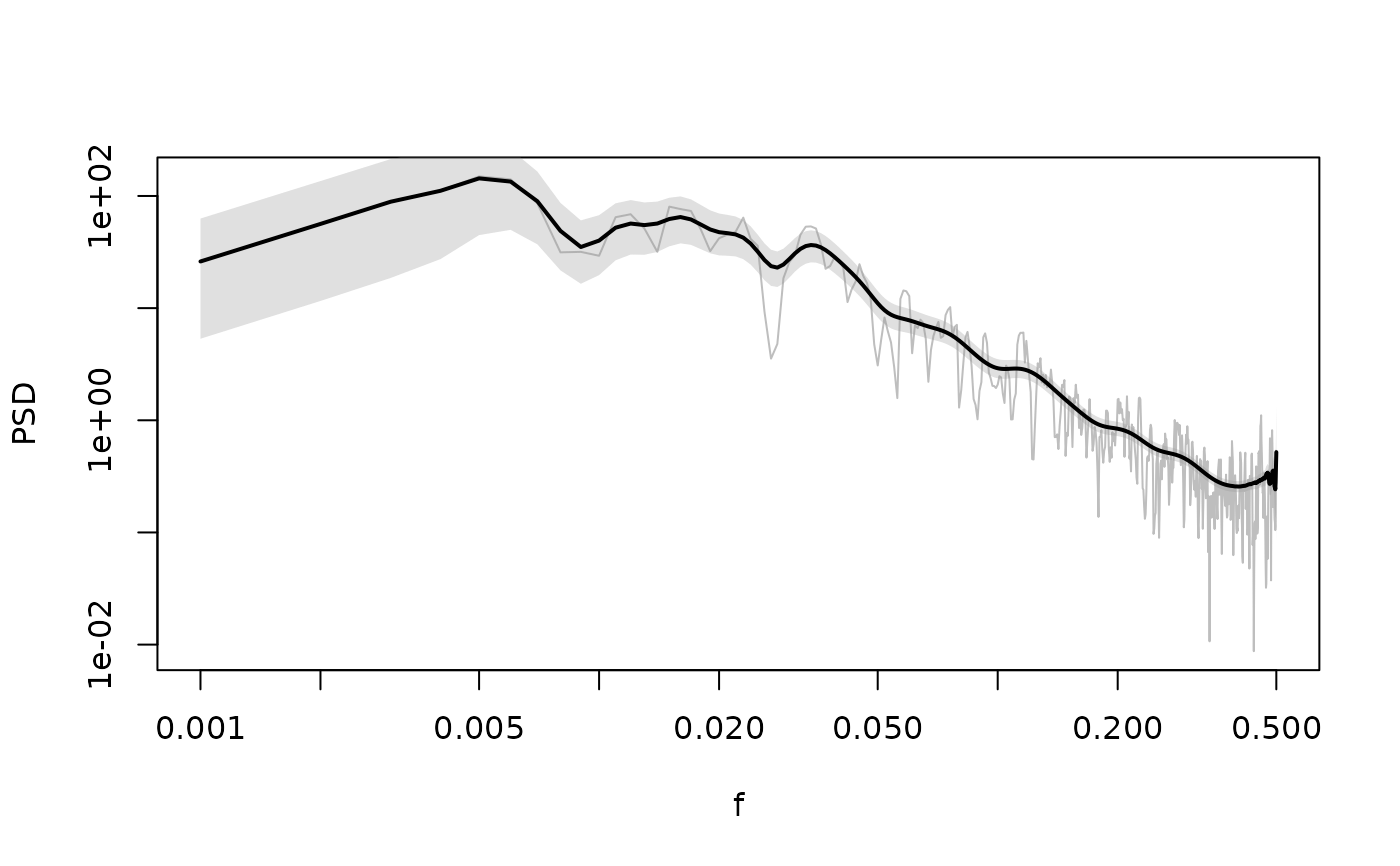
Log-log spectral plot.
LPlot.RdThis function plots a spectrum on a double-logarithmic scale and optionally adds a transparent confidence interval.
Usage
LPlot(
  x,
  conf = TRUE,
  bPeriod = FALSE,
  bNoPlot = FALSE,
  axes = TRUE,
  col = "black",
  alpha = 0.3,
  removeFirst = 0,
  removeLast = 0,
  xlab = "f",
  ylab = "PSD",
  xlim = NULL,
  ylim = NULL,
  log = "xy",
  ...
)
Arguments
- x
a spectral object resulting from a call to
SpecMTM.- conf
if
TRUE(the default) add a transparent confidence interval (suppressed ifxcontains no error limits).- bPeriod
if
TRUEthe x-axis is displayed in units of period (inverse frequency), increasing to the left. Defaults toFALSE.- bNoPlot
if
TRUEonly produce the plot frame (type = "n"behaviour of functionplot). Defaults toFALSE.- axes
if
FALSEthe plotting of the x and y axes is suppressed. Defaults toTRUE.- col
color for the line plot and the confidence interval.
- alpha
transparency level (between 0 and 1) for the confidence interval. Defaults to
0.3.- removeFirst
omit
removeFirstvalues on the low frequency side.- removeLast
omit
removeLastvalues on the high frequency side.- xlab
character string for labelling the x-axis.
- ylab
character string for labelling the y-axis.
- xlim
range of x-axis values; if
NULL(the default) it is calculated internally and automatically reversed forbPeriod = TRUE.- ylim
range of y-axis values; if
NULL(the default) it is calculated internally.- log
a character string which contains
"x"if the x axis is to be logarithmic,"y"if the y axis is to be logarithmic and"xy"or"yx"if both axes are to be logarithmic.- ...
further graphical parameters passed to
plot.