Add confidence interval
AddConfInterval.RdCalculated confidence intervals give the interval within which the true spectrum should lie with frequency 1-p. This behaviour changed with version 0.33.
Previous versions returned the interval which, when applied to the 'true' spectrum, would contain new spectral estimates with frequency 1-p.
Arguments
- spec
a spectral object of class
"spec"or a list with the minimum componentsspecanddofwhich are vectors of the same length giving the spectral estimates and the corresponding degrees of freedom.- pval
numeric; p value for the confidence interval, i.e. the interval is constructed from pval / 2 to 1 - pval / 2.
- MINVALUE
numeric; minimum value to limit the confidence interval.
Value
the input object including the new list elements lim.1 and
lim.2 giving the upper and lower bound of the confidence interval,
respectively.
Details
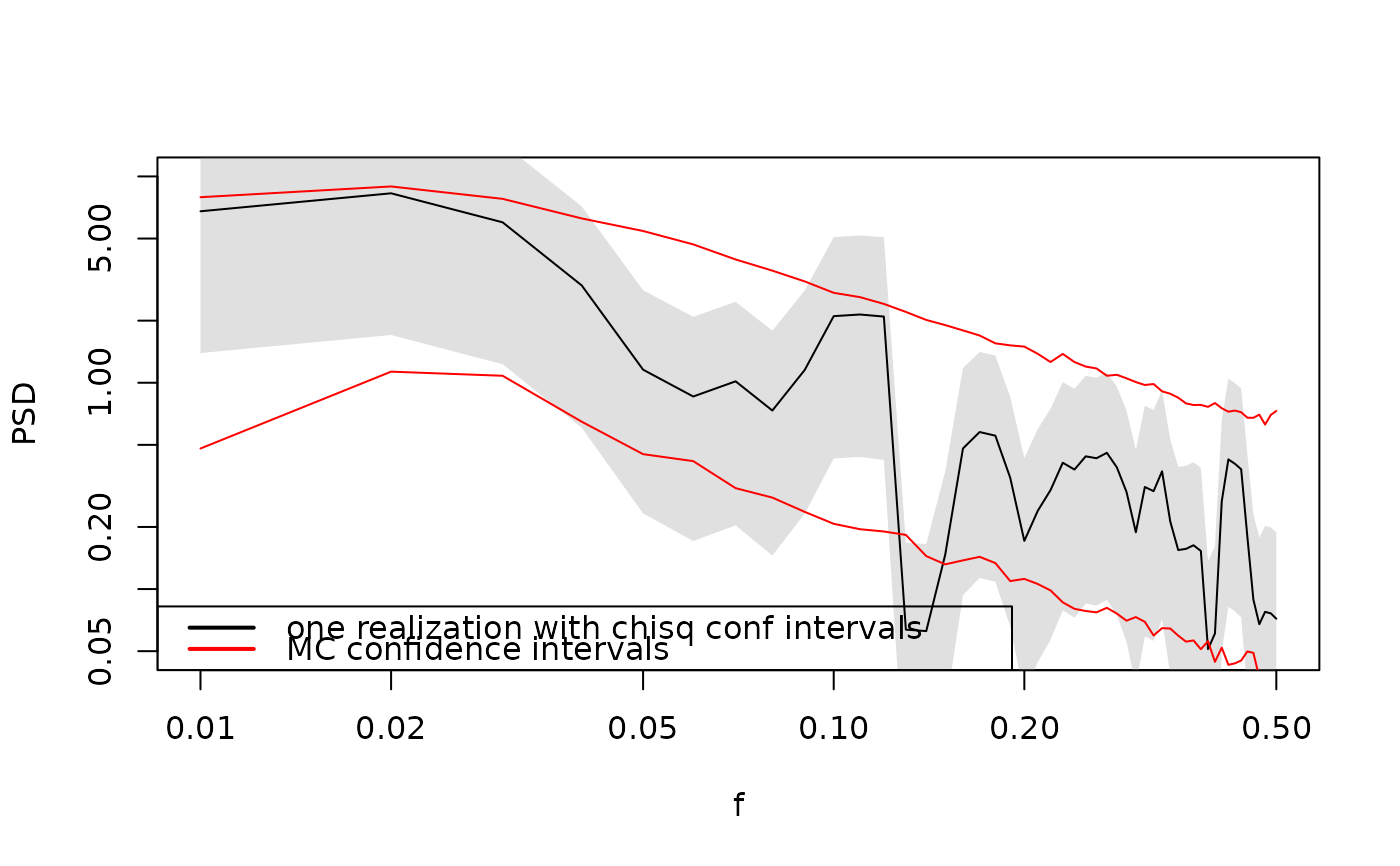
Add a confidence interval to a spectral estimate assuming the uncertainty of the spectral estimates follows a chi-squared distribution with the degrees of the freedom from the spectral estimates.
Examples
alpha <- 0.1
beta <- 1

spec_sim <- SpecMTM(ts(SimPLS(N = 1e03, beta = beta, alpha = alpha)))

# Using a large nominal p value of 0.25 to reduce variation between random
# timeseries

# The true spec should be p/2 times above the lower CI, and p/2 below the upper CI

nominal_p <- 0.25
spec_sim <- AddConfInterval(spec_sim, pval = nominal_p)
true_spec <- alpha * spec_sim$freq^-beta

LPlot(spec_sim)
abline(a = log10(alpha), b = -beta, lty = 2, col = "red")


SpecCoverage <- function(spec, true_spec){

  stopifnot("lim.1" %in% names(spec))

  n <- length(spec$freq)
  below <- sum(spec$lim.1 < true_spec)
  above <- sum(spec$lim.2 > true_spec)

  total <- below + above

  count <- list(n = n, above = above, below = below, total = total,
                p_above = above / n, p_below = below / n,
                p_total = total / n,
                nominal_pval = spec$pval)

  as.data.frame(count)
}

SpecCoverage(spec_sim, true_spec)
#>     n above below total p_above p_below p_total nominal_pval
#> 1 500    52    43    95   0.104   0.086    0.19         0.25
SpecCoverage <- function(spec, true_spec){
stopifnot("lim.1" %in% names(spec))
n <- length(spec$freq)
below <- sum(spec$lim.1 < true_spec)
above <- sum(spec$lim.2 > true_spec)
total <- below + above
count <- list(n = n, above = above, below = below, total = total,
p_above = above / n, p_below = below / n,
p_total = total / n,
nominal_pval = spec$pval)
as.data.frame(count)
}
SpecCoverage(spec_sim, true_spec)
#> n above below total p_above p_below p_total nominal_pval
#> 1 500 52 43 95 0.104 0.086 0.19 0.25