library(PaleoSpec)
library(ggplot2)6 Variance from a power spectrum
The integral of the full power spectrum is equal to the variance of the whole time series. We can calculate this by summing the spectral estimates and multiplying by delta_f.
set.seed(20240228)
N <- 1e03
delta_t = 1

ts1 <- ts(rnorm(N), deltat = delta_t) * 5
sp1 <- SpecMTM(ts1, detrend = TRUE)gg_spec(sp1) +
scale_x_continuous() Scale for colour is already present.
Adding another scale for colour, which will replace the existing scale.
Scale for x is already present.
Adding another scale for x, which will replace the existing scale.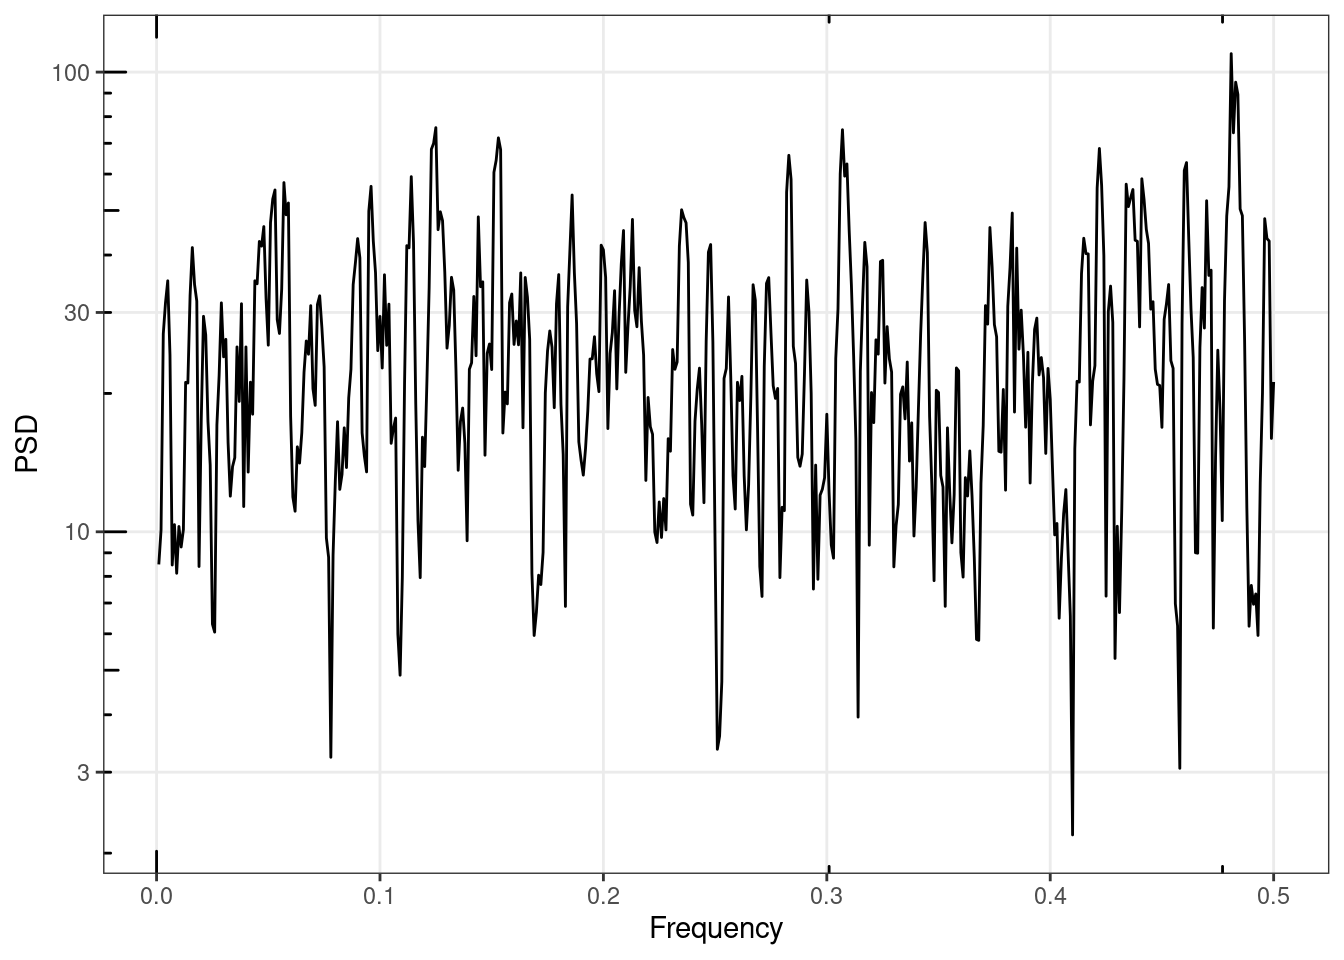
Note that SpecMTM returns only the positive frequencies, therefore to get the total variance we must multiply by a factor of 2.
var(ts1)[1] 25.294122 * sum(sp1$spec) * diff(sp1$freq)[1][1] 25.67279Why are these not identical?
6.1 Variance by timescale
As we simulated a “white” time series, the total variance of the time series is spread equally across all frequencies. Therefore the integrals of the lower and upper halves of the power spectrum are expected to be equal to each other and sum to the variance of the whole time series.
PaleoSpec has a function GetVarFromSpectra() which we will use to integrate sections of the power spectrum
f_range <- c(1/N, 1/2)
f_range_low <- c(1/N, mean(f_range))
f_range_high <- c(mean(f_range), 1/2)

PaleoSpec::GetVarFromSpectra(sp1, f_range)
$var
[1] 25.63878
$dof
[1] 959.4585PaleoSpec::GetVarFromSpectra(sp1, f_range_low)$var
[1] 12.97496
$dof
[1] 481.1547PaleoSpec::GetVarFromSpectra(sp1, f_range_high)$var
[1] 12.66096
$dof
[1] 478.2898PaleoSpec::GetVarFromSpectra(sp1, f_range_low)$var +
PaleoSpec::GetVarFromSpectra(sp1, f_range_high)$var[1] 25.63592In contrast, if we simulated a time series where the variance increases with timescale, integrating different parts of its power spectrum will yield different variances.
ts2 <- ts(PaleoSpec::SimPLS(N, beta = 1, alpha = 0.1))
plot(ts2)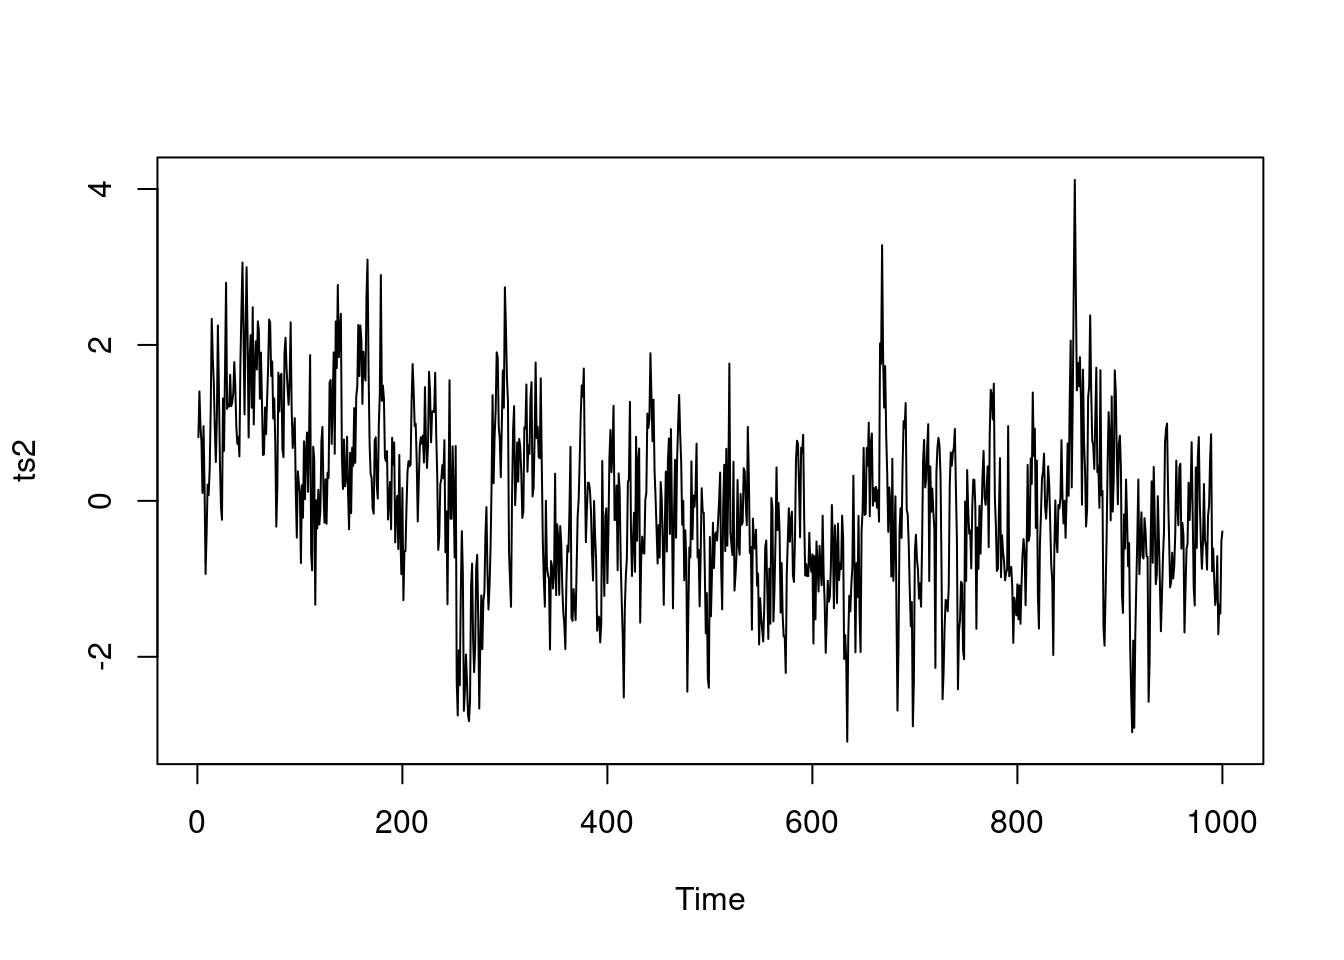
sp2 <- SpecMTM(ts2)

gg_spec(sp2)  +
  scale_x_continuous()+
  geom_vline(xintercept = mean(f_range), colour = "red")
Scale for colour is already present.
Adding another scale for colour, which will replace the existing scale.
Scale for x is already present.
Adding another scale for x, which will replace the existing scale.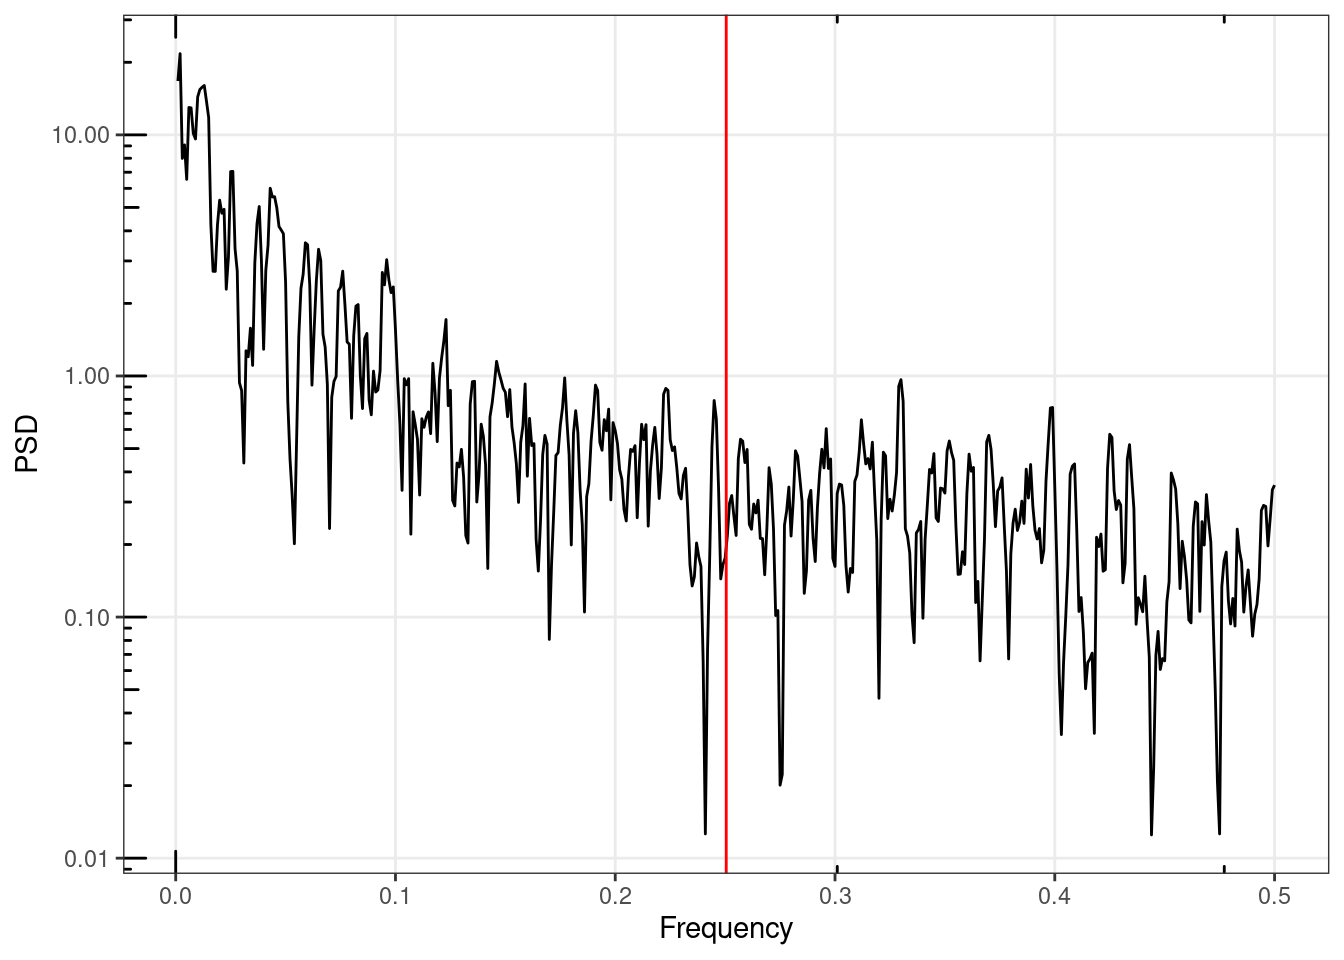
var_low_2 <- PaleoSpec::GetVarFromSpectra(sp2, f_range_low)
var_high_2 <- PaleoSpec::GetVarFromSpectra(sp2, f_range_high)

var_low_2
$var
[1] 0.9412515
$dof
[1] 473.2349var_high_2$var
[1] 0.1324684
$dof
[1] 435.3166The sum of the two variances calculated by integrating the two halves of the power spectrum should still be equal to the total variance of the time series.
var_low_2$var + var_high_2$var[1] 1.07372var(ts2)[1] 1.24744When a time series has increasing power at lower frequencies, the variance estimated from the power spectrum will be lower than the true variance, because the detrending of the time series prior to estimating the power spectrum removes power from the lowest frequencies. See Section 3.3 .