Plot the spectral transfer functions of the effects of diffusion-like smoothing and/or time uncertainty.
Usage
PlotTF(
  dtf = NULL,
  ttf = NULL,
  names = NULL,
  col = NULL,
  dtf.threshold = NULL,
  xlab = "Time period (yr)",
  ylab1 = expression(bar(G)),
  ylab2 = expression(Phi),
  xlim = c(500, 2),
  ylim1 = c(0.005, 5),
  ylim2 = c(0.2, 1.5),
  xtm = NULL,
  ytm1 = NULL,
  ytm2 = NULL,
  xtl = NULL,
  ytl1 = NULL,
  ytl2 = NULL
)
Arguments
- dtf
a list of spectral objects (
?spec.object) of the transfer function datasets that describe a diffusion-type smoothing process. See Details for the meaning ofNULL.- ttf
as
dtfbut providing time uncertainty transfer functions. See Details for the meaning ofNULL.- names
an optional character vector of names for the transfer function datasets. If
NULL, the names ofdtfandttfare used or, if not present, default names. Provide a list of two vectors of names, if the diffusional smoothing and time uncertainty datasets differ in number, or, if they do **not** differ in number but belong to different underlying datasets.- col
a numeric or character vector of colors to use for the plotting; if
NULLdefault colors are used.- dtf.threshold
optional critical diffusion transfer function value to plot a corresponding horizontal line and vertical lines of corresponding frequency cutoff values (omitted for
NULL).- xlab
x axis label.
- ylab1
y axis label for the diffusion transfer function.
- ylab2
y axis label for the time uncertainty transfer function.
- xlim
the x limits (x1, x2) of the plot.
- ylim1
the y limits (y1, y2) of the diffusion transfer function plot.
- ylim2
the y limits (y1, y2) of the time uncertainty transfer function plot.
- xtm
x axis tick mark positions; if
NULLcomputed byaxis.- ytm1
y axis tick mark positions on the diffusion transfer function plot; default setting (
NULL) usesc(0.01, 0.05, 0.1, 0.5, 1, 5).- ytm2
y axis tick mark positions on the time uncertainty transfer function plot; default setting (
NULL) usesc(0.2, 0.4, 0.6, 0.8, 1, 1.2).- xtl
x axis tick mark labels; if
NULLdetermined automatically fromxtm, else it must be a vector of labels of the same length asxtm.- ytl1
y axis tick mark labels on the diffusion transfer function plot; if
NULLdetermined automatically fromytm1, else it must be a vector of labels of the same length asytm1.- ytl2
as
ytl1for the y axis on the time uncertainty transfer function plot.
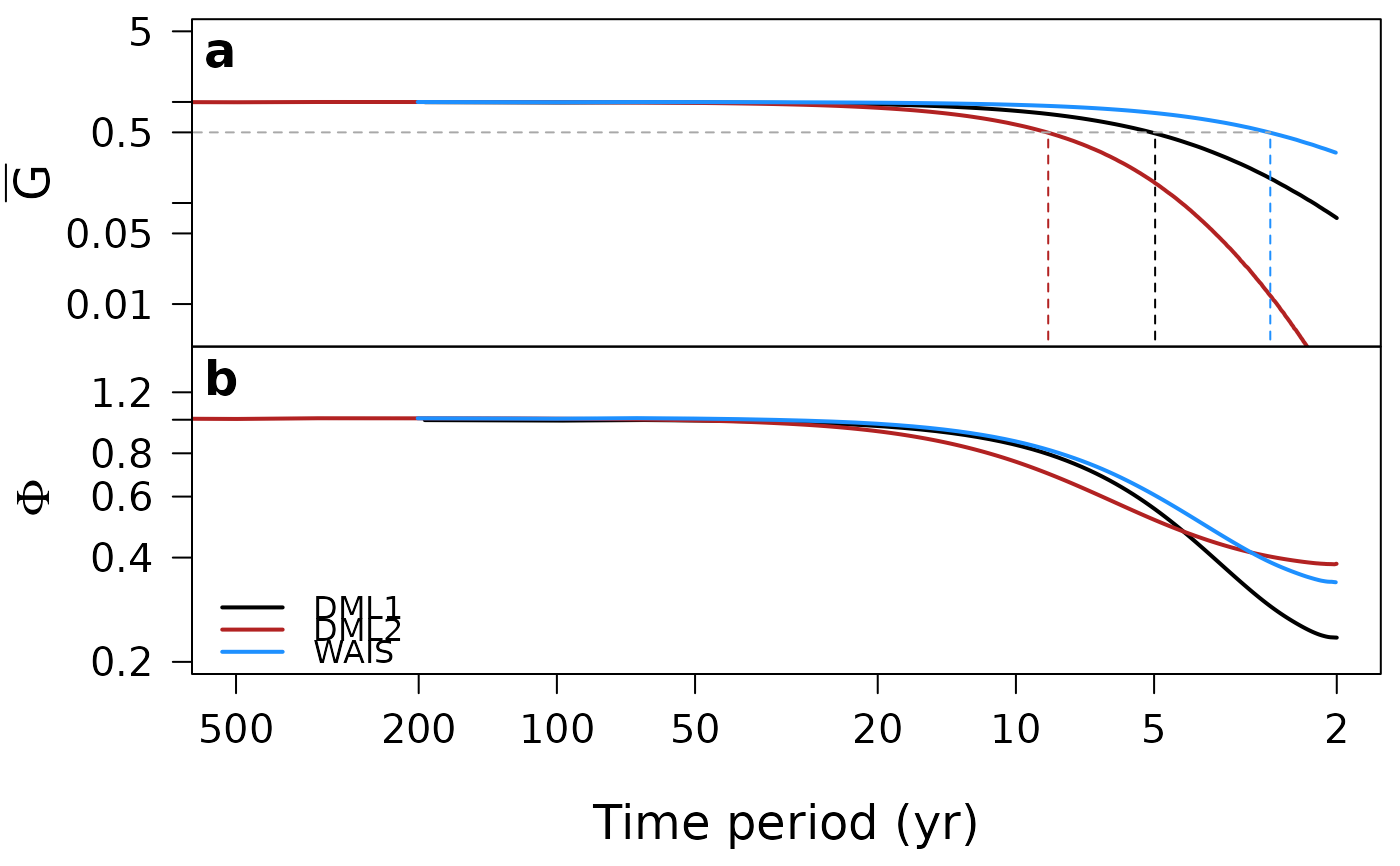
Details
You can plot only transfer functions describing diffusion-like smoothing
processes by supplying the respective data to the dtf parameter and
leaving the ttf parameter as NULL, or vice versa for plotting
only time uncertainty transfer functions. Supplying both parameters will plot
the supplied diffusional smoothing as well as time uncertainty transfer
functions (which can differ in number) on a single plot with a shared x
axis. Leaving both the dtf and ttf parameters as NULL
(the default) will plot the firn diffusion and time uncertainty transfer
functions that are provided with the proxysnr package, which
corresponds to Figure B1 in Münch and Laepple (2018).
References
Münch, T. and Laepple, T.: What climate signal is contained in decadal- to centennial-scale isotope variations from Antarctic ice cores? Clim. Past, 14, 2053–2070, https://doi.org/10.5194/cp-14-2053-2018, 2018.
See also
spec.object for the definition of a proxysnr
spectral object.