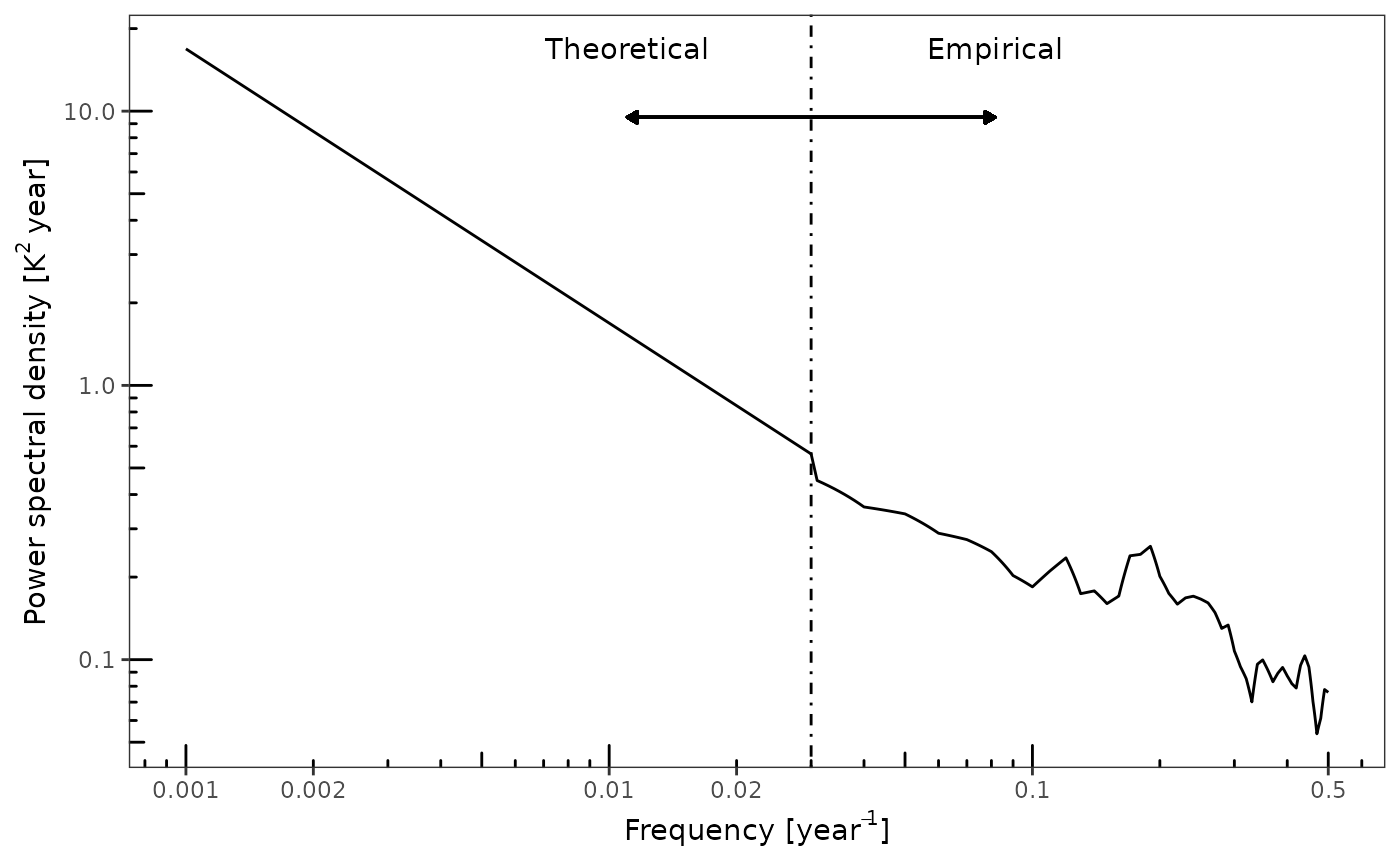
Plot a spliced empirical / power-law climate spectrum
PlotModelSpectrum.RdPlot a spliced empirical / power-law climate spectrum
Examples
clim.spec <- ModelSpectrum(
  freq = NULL,
  latitude = 20,
  variable = "temperature",
   beta = 1)

PlotModelSpectrum(clim.spec)
#> Warning: All aesthetics have length 1, but the data has 500 rows.
#> ℹ Did you mean to use `annotate()`?