Plot Time-scale Dependent Variance Object.
PlotTSDVariance.RdPlot Time-scale Dependent Variance Object.
Arguments
- var.obj
Object of class proxy.error.var, e.g. output from IntegrateErrorSpectra
- components
Which error components to include or exclude
- include
Include or exclude components named in
components- include.constant.errors
Include the constant (nu = 0) error components
- units
Are the units degC or d18O, used for axis labelling
- thin.var.obj
If TRUE and the variance object contains more than 1000 frequencies these are thinned to 1000 frequencies equally spaced on a log-scale
Examples
spec.pars <- GetSpecPars("Mg_Ca", delta_phi_c = pi)
spec.obj <- do.call(ProxyErrorSpectrum, spec.pars)
#> Warning: Rounding T to 10100 so that T is an odd integer multiple of delta_t

var.obj <- IntegrateErrorSpectra(spec.obj)
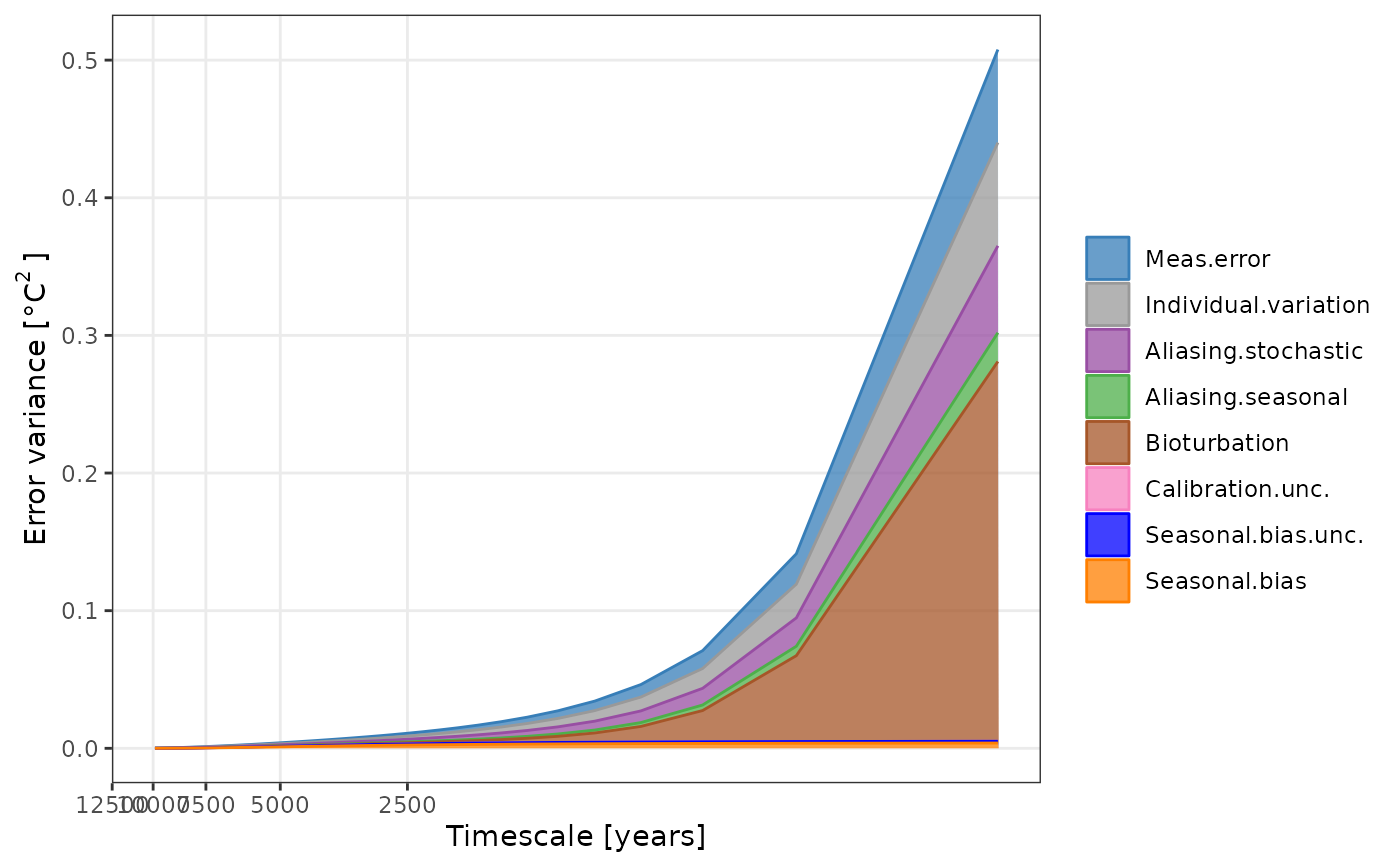
PlotTSDVariance(var.obj, units = "degC")
#> Warning: Removed 8 rows containing non-finite outside the scale range (`stat_align()`).

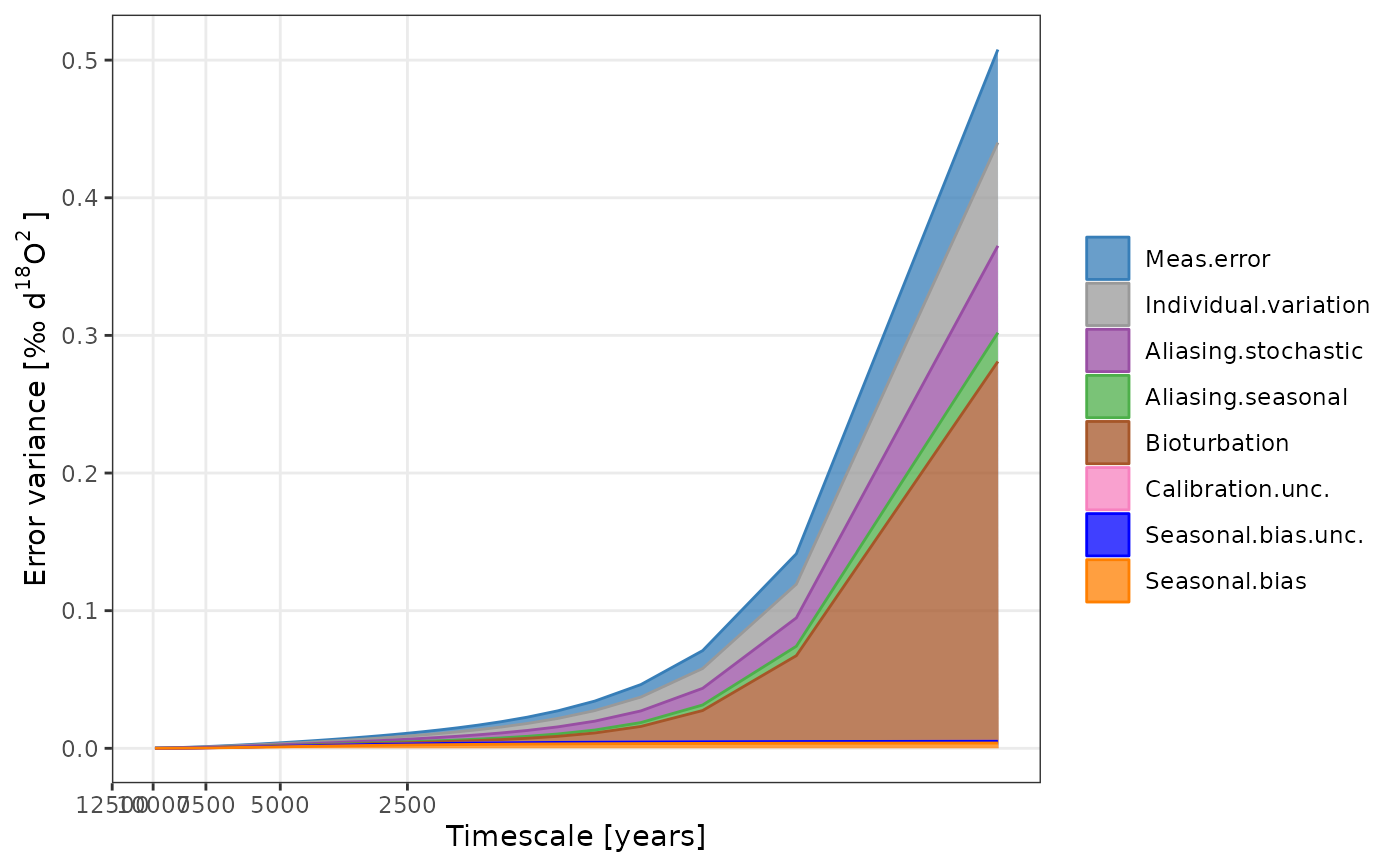
PlotTSDVariance(var.obj, units = "d18O")
#> Warning: Removed 8 rows containing non-finite outside the scale range (`stat_align()`).

PlotTSDVariance(var.obj, include = FALSE, c("Seasonal.bias", "Calibration.unc."))
#> Warning: Removed 6 rows containing non-finite outside the scale range (`stat_align()`).

PlotTSDVariance(var.obj, include.constant.error = TRUE)
#> Warning: Removed 8 rows containing non-finite outside the scale range (`stat_align()`).
