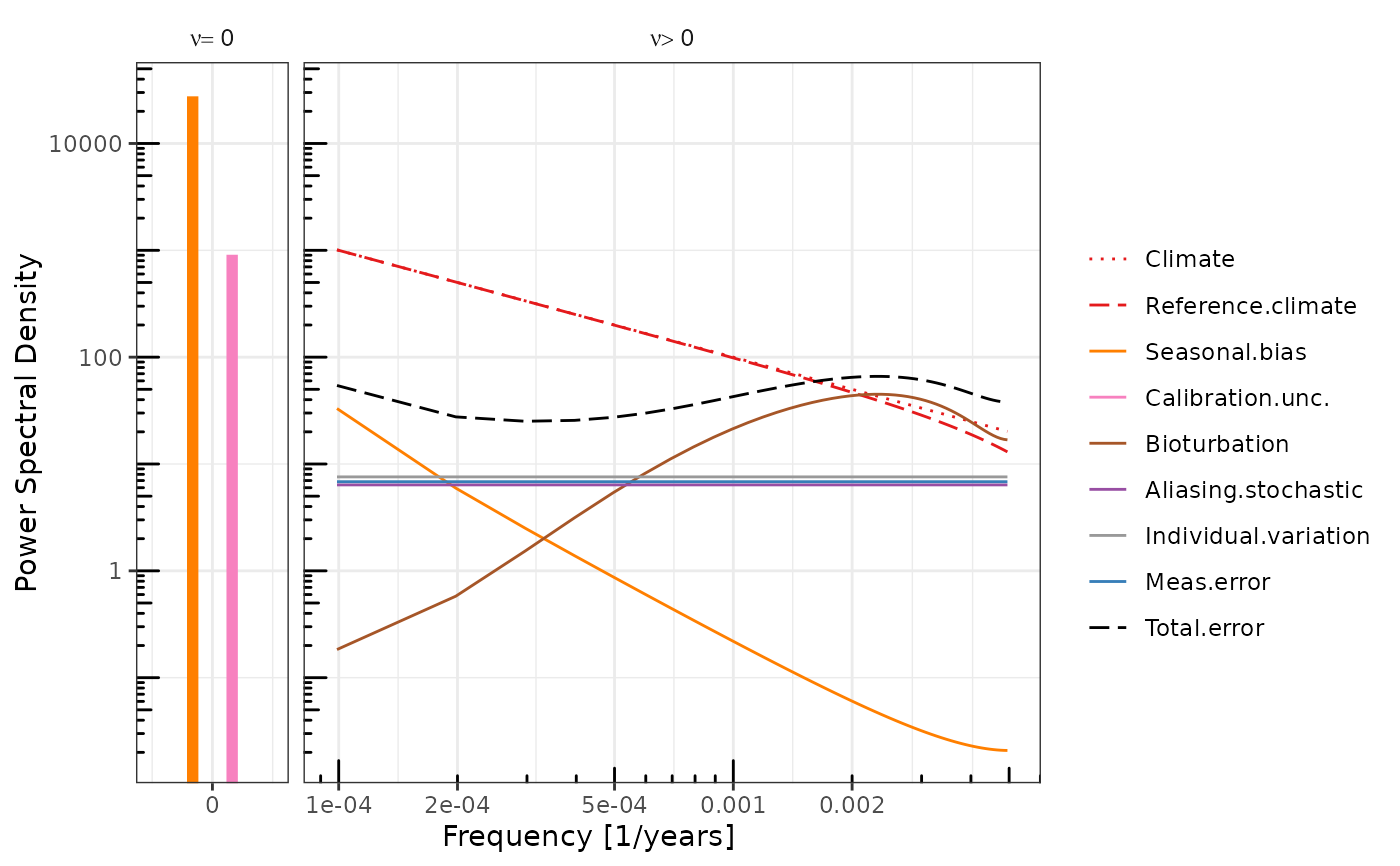
Plot a proxy error spectrum
PlotSpecError.RdPlot a proxy error spectrum
Arguments
- pes
Object of class proxy.error.spec, e.g. output from ProxyErrorSpectrum
- show.low.power.panel
Show components with very low power in an additional panel (otherwise they are excluded)
Examples
spec.pars <- psem::GetSpecPars("Mg_Ca", T = 1e04)
spec.obj <- do.call(psem::ProxyErrorSpectrum, spec.pars)
#> Warning: Rounding T to 10100 so that T is an odd multiple of delta_t
PlotSpecError(spec.obj)
#> Warning: There were 4 warnings in `summarise()`.
#> The first warning was:
#> ℹ In argument: `max.spec = max(spec, na.rm = TRUE)`.
#> ℹ In group 9: `component = "Climate"` and `ax.grp = "nu == 0"`.
#> Caused by warning in `max()`:
#> ! no non-missing arguments to max; returning -Inf
#> ℹ Run `dplyr::last_dplyr_warnings()` to see the 3 remaining warnings.
#> Joining with `by = join_by(component, ax.grp)`
#> Warning: log-10 transformation introduced infinite values.
#> `geom_line()`: Each group consists of only one observation.
#> ℹ Do you need to adjust the group aesthetic?