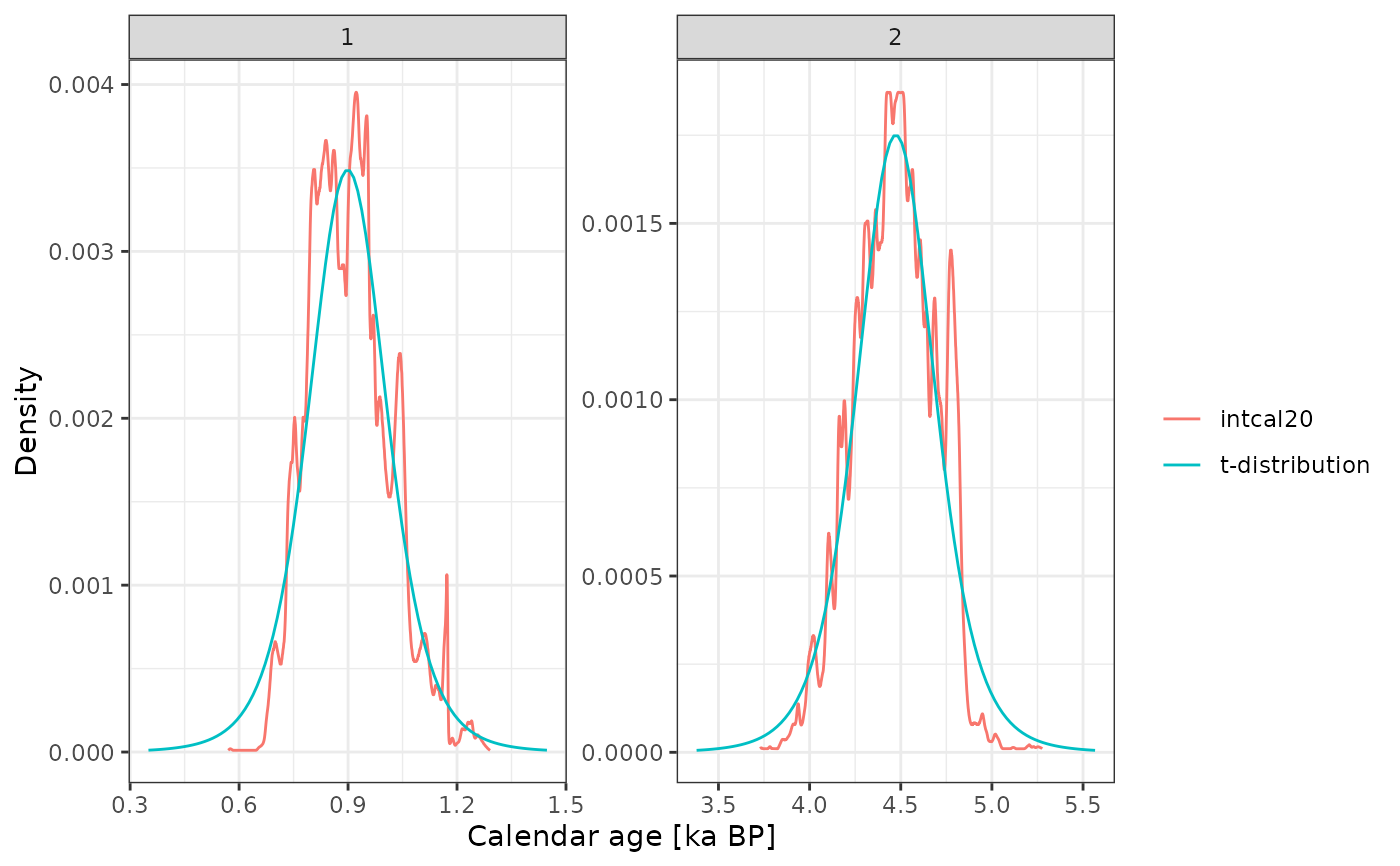
Compare Empirical and t-distribution Approximated Calendar Age PDFs
compare_14C_PDF.RdCompare the full empirical calendar age PDFs of calibrated radiocarbon dates with the t-distribution approximations use by hamstr
Usage
compare_14C_PDF(
  age.14C,
  age.14C.se,
  offset = 0,
  offset.se = 0,
  cal_curve = "intcal20",
  nu = 6,
  return.type = c("plot", "list")
)
Arguments
- age.14C
vector of radiocarbon dates in years BP
- age.14C.se
vector of radiocarbon date uncertainties
- offset
vector of offsets, e.g. reservoir ages.
- offset.se
vector of offset uncertainties, e.g. sigmaDelatR.
- cal_curve
calibration curve
- nu
degrees of freedom of the t-distribution approximation, default in hamstr is 6
- return.type
return a ggplot object or a list containing the ggplot object and two data frames with the empirical and t-distributions
